Note
Go to the end to download the full example code.
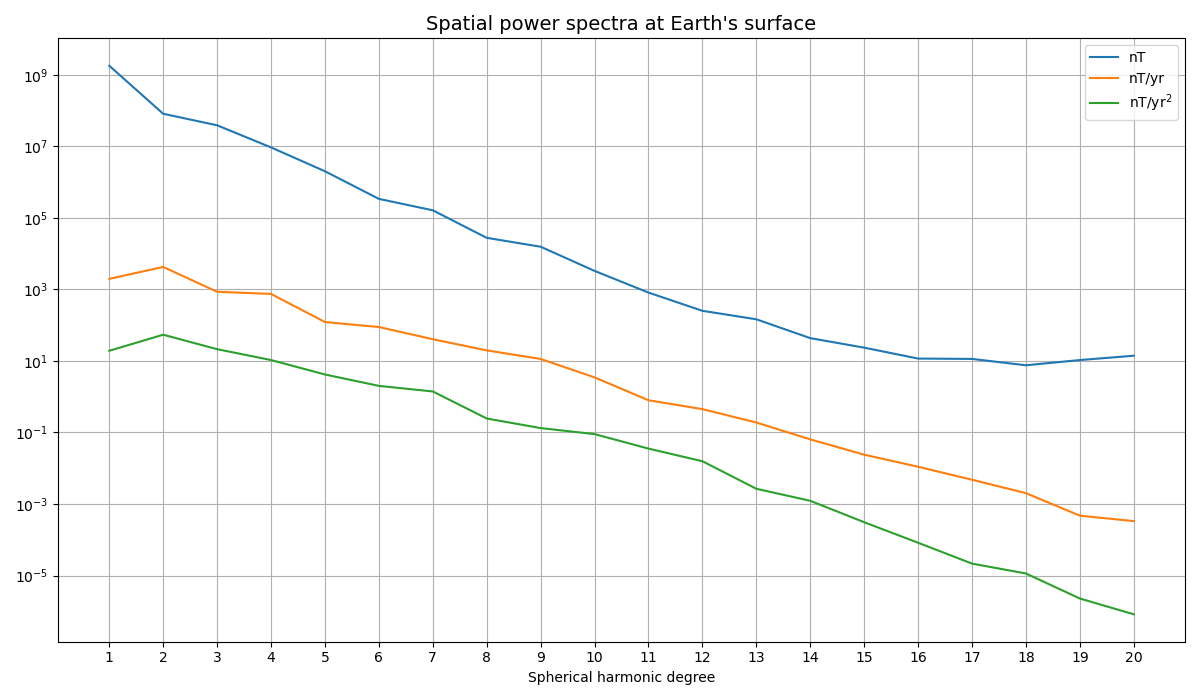
Spatial Power Spectra
This script creates a plot of the spatial power spectrum of the time-dependent internal field from the CHAOS geomagnetic field model.
/home/docs/checkouts/readthedocs.org/user_builds/chaosmagpy/checkouts/master/chaosmagpy/chaos.py:2933: UserWarning: Missing ionospheric field coefficients: 'model_ion'
  warnings.warn(f'Missing ionospheric field coefficients: {err}')
import chaosmagpy as cp
import matplotlib.pyplot as plt
import matplotlib.ticker as ticker
import numpy as np

model = cp.CHAOS.from_mat('CHAOS-7.mat')  # load the mat-file of CHAOS-7

nmax = 20
time = cp.data_utils.mjd2000(2018, 1, 1)
degrees = np.arange(1, nmax+1, dtype=int)

fig, ax = plt.subplots(1, 1, figsize=(12, 7))

for deriv, label in enumerate(['nT', 'nT/yr', 'nT/yr$^2$']):

    # get spatial power spectrum from time-dependent internal field in CHAOS
    spec = model.model_tdep.power_spectrum(time, nmax=nmax, deriv=deriv)
    ax.semilogy(degrees, spec, label=label)

ax.legend()
ax.grid(which='both')

ax.yaxis.set_major_locator(ticker.LogLocator(base=10.0, numticks=15))
ax.xaxis.set_major_locator(ticker.MultipleLocator(1))

ax.set_title("Spatial power spectra at Earth's surface", fontsize=14)
ax.set_xlabel('Spherical harmonic degree')

plt.tight_layout()
plt.show()
Total running time of the script: (0 minutes 0.264 seconds)